Choosing the right data analytics course in Jaipur can be confusing because most institutes don’t clearly explain what you will actually learn. This is why transparency matters.
In this guide, we break down the real step-by-step structure of a data analytics course so you know exactly what skills you’ll gain and how they help you become job-ready.
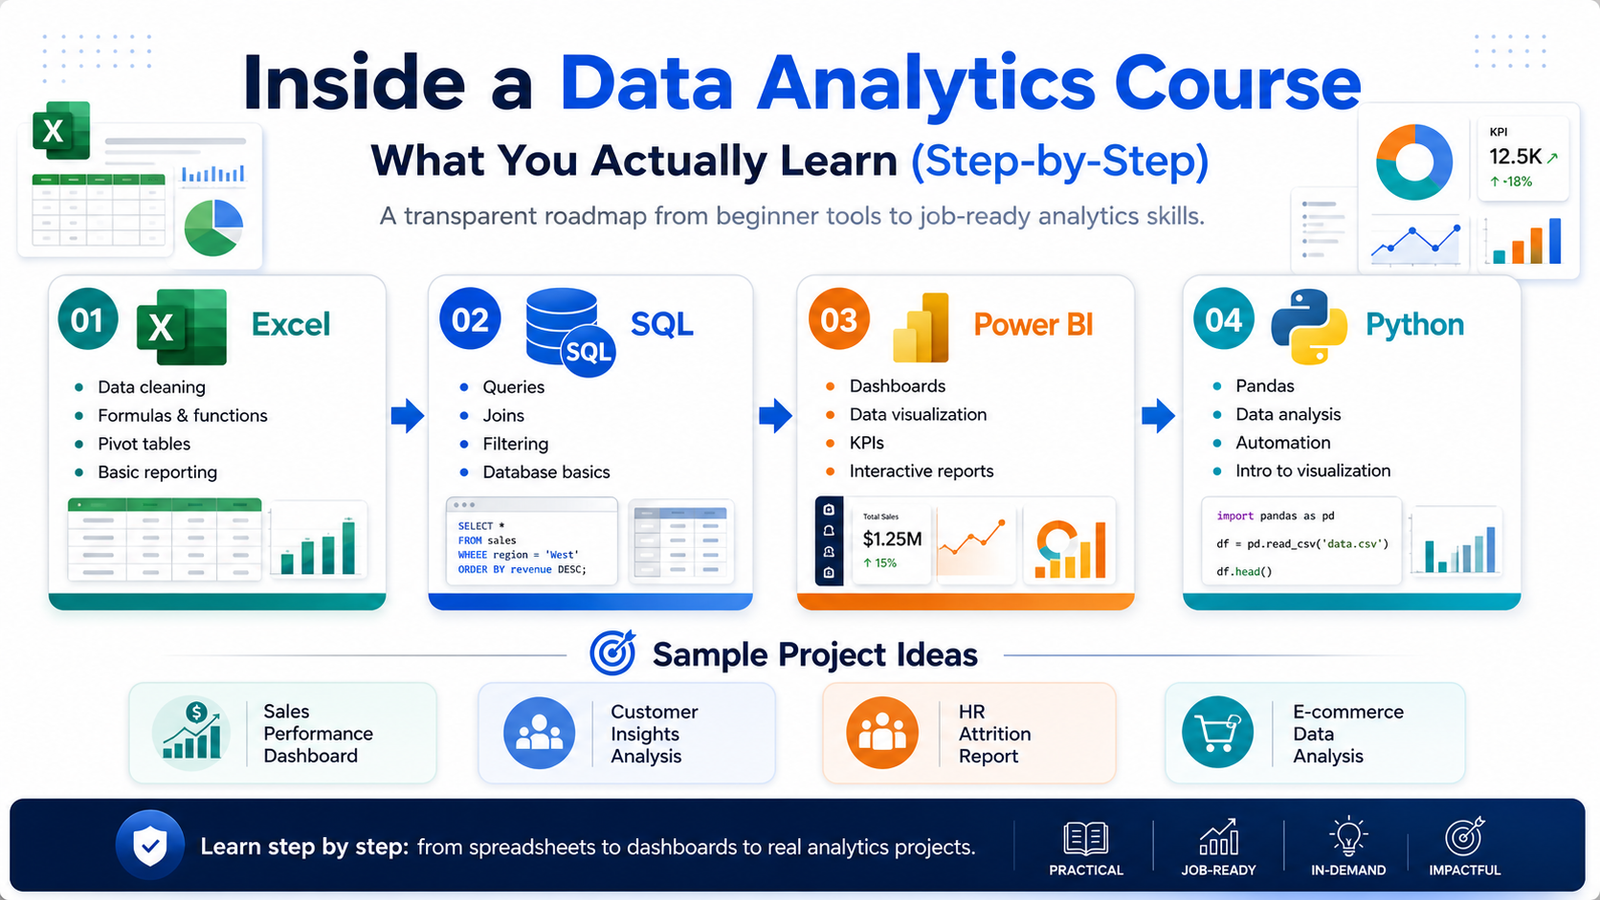
Data Analytics Course in Jaipur: Step 1 – Excel Foundation
Every data analytics journey starts with Excel.
You will learn:
- Data cleaning and formatting
- Pivot tables and dashboards
- Advanced formulas like VLOOKUP and INDEX MATCH
Excel helps you understand data behavior before moving to advanced tools.
Data Analytics Course in Jaipur: Step 2 – SQL for Data Handling
SQL is essential for working with large datasets.
You will learn:
- Writing queries (SELECT, JOIN, GROUP BY)
- Data filtering and aggregation
- Working with real databases
SQL is used in almost every company, making it a must-have skill.
Data Analytics Course in Jaipur: Step 3 – Power BI for Visualization
Power BI helps convert raw data into insights.
You will learn:
- Creating dashboards
- Data visualization techniques
- Business reporting
This is where data becomes useful for decision-making.
Data Analytics Course in Jaipur: Step 4 – Python for Advanced Analysis
Python takes your skills to the next level.
You will learn:
- Data analysis using Pandas
- Visualization using Matplotlib
- Basic machine learning concepts
Python allows you to work with complex datasets efficiently.
Real Learning Roadmap
Excel → SQL → Power BI → Python
This structured path ensures strong fundamentals and smooth progression.
Sample Projects You Will Build
A good data analytics course in Jaipur always includes real projects.
1. Sales Dashboard (Excel + Power BI)
- Analyze sales data
- Create interactive dashboards
2. Customer Analysis (SQL)
- Extract insights
- Identify patterns
3. Business Insights Dashboard (Power BI)
- Visualize KPIs
- Create reports
4. Python Data Analysis Project
- Clean and analyze datasets
- Generate insights
These projects help you build a strong portfolio.
Why Transparency in Learning Matters
Many students join courses without knowing what they will actually learn.
This leads to confusion and wasted time.
A clear roadmap helps you:
- Build confidence
- Stay focused
- Become job-ready
The Right Approach to Learning
- Start with basics
- Practice consistently
- Build real projects
- Focus on skills over theory
Final Thoughts
A data analytics course in Jaipur should not just teach tools—it should help you build real skills.
If you follow a structured roadmap and focus on practical learning, you can build a successful career in data analytics.