In today’s digital world, businesses generate massive amounts of data every day.
From customer purchases and website traffic to sales performance and marketing campaigns, companies are constantly collecting information.
But raw data alone is not valuable.
The real value comes from understanding that data and using it to make smarter business decisions.
This is where Data Analytics becomes powerful.
Data Analytics helps businesses identify trends, improve efficiency, understand customer behavior, and make data-driven decisions instead of relying only on assumptions.
In 2026, almost every industry—from startups to multinational companies—is using data analytics to grow faster and compete smarter.
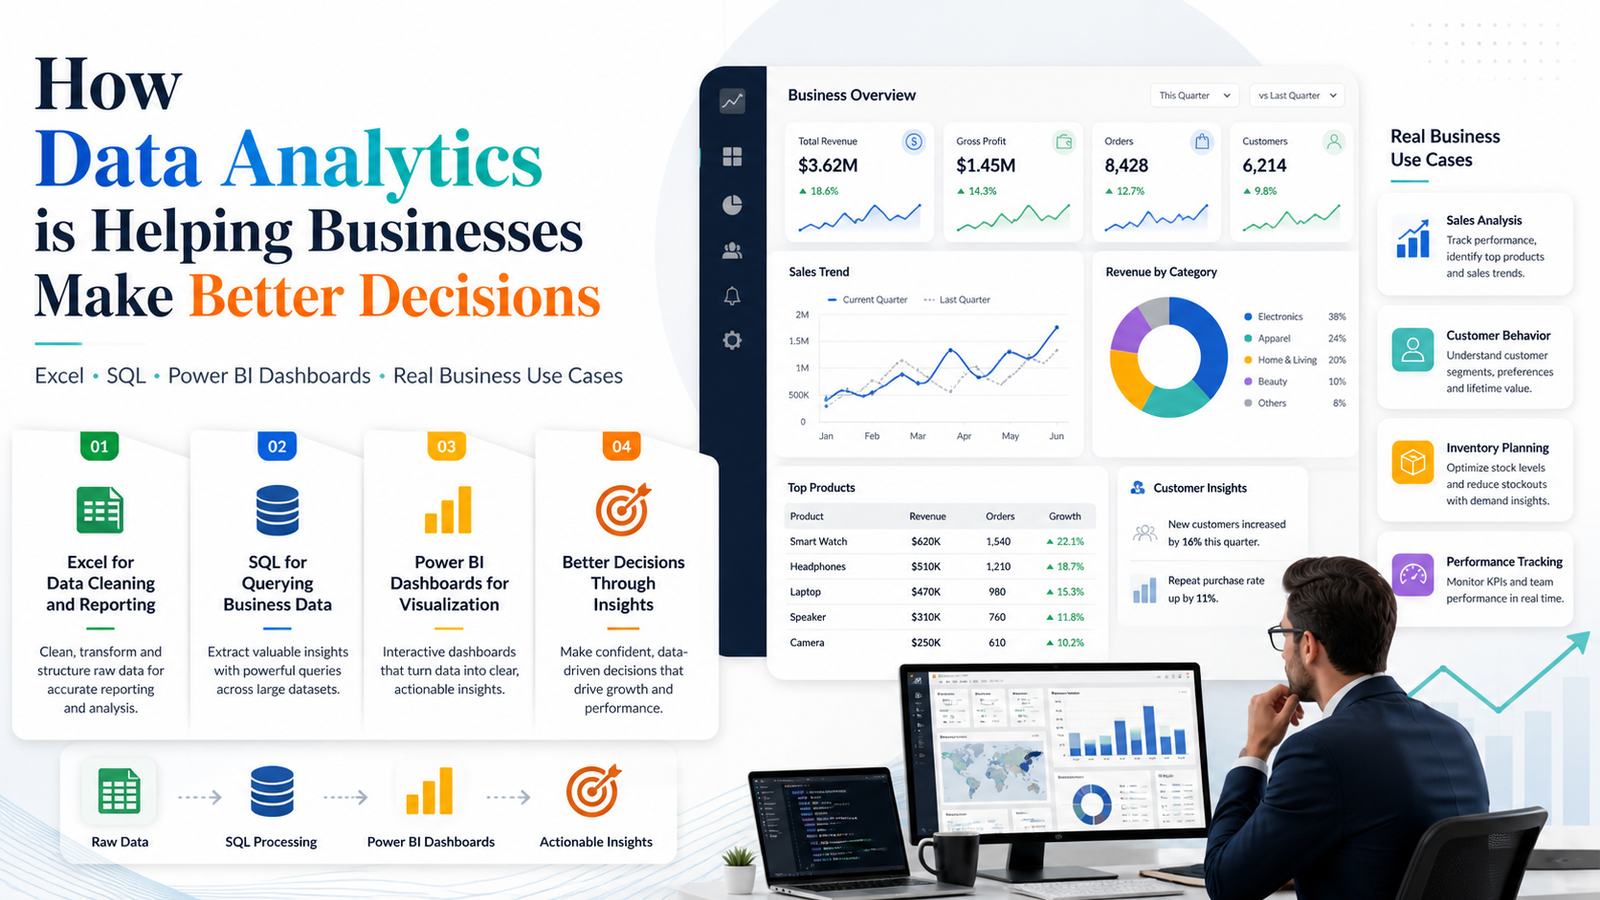
This guide explains how data analytics is helping businesses make better decisions and why data analytics skills are becoming highly valuable.
🚀 What is Data Analytics?
Data Analytics is the process of collecting, organizing, analyzing, and visualizing data to extract meaningful insights.
Businesses use analytics to answer questions like:
- Which products sell the most?
- Why are customers leaving?
- Which marketing campaigns work best?
- How can operational costs be reduced?
Instead of making guesses, companies use data to make informed decisions.
📊 Why Businesses Depend on Data Analytics
Modern businesses compete using data.
Companies that understand their data can:
✔ Improve decision-making
✔ Increase revenue
✔ Reduce business risks
✔ Understand customer behavior
✔ Improve efficiency
This is why demand for Data Analysts is growing rapidly.
📈 Excel: The Foundation of Data Analytics
Excel is still one of the most widely used tools in business analytics.
Even large companies use Excel daily for:
- Reporting
- Data cleaning
- Sales analysis
- Financial tracking
Important Excel Skills:
- Formulas & functions
- Pivot tables
- Data visualization
- Lookup functions
- Dashboards
👉 Excel helps businesses quickly analyze and organize information.
🗄️ SQL: Managing Business Data
Most companies store data inside databases.
SQL (Structured Query Language) helps analysts access and manage that data.
What Businesses Use SQL For:
- Extracting customer data
- Sales analysis
- Performance reporting
- Business intelligence
Common SQL Tasks:
- Filtering data
- Joining tables
- Aggregating business metrics
- Creating reports
👉 SQL is one of the most essential skills for Data Analysts.
📊 Power BI Dashboards: Visualizing Insights
Businesses often struggle to understand large amounts of raw data.
This is why visualization tools like Power BI are extremely important.
Power BI dashboards convert complex data into simple visual insights.
Businesses Use Power BI For:
✔ Sales dashboards
✔ Marketing performance tracking
✔ Financial analysis
✔ HR analytics
✔ Customer behavior analysis
Benefits of Dashboards:
- Faster decision-making
- Easy reporting
- Real-time business insights
- Better communication between teams
👉 Visualization helps companies understand patterns quickly.
💼 Real Business Use Cases of Data Analytics
1. Retail Industry
Retail companies use analytics to:
- Predict customer buying behavior
- Optimize inventory
- Increase sales
👉 Example: Identifying best-selling products during festivals.
2. Marketing & Advertising
Businesses analyze:
- Ad performance
- Website traffic
- Customer engagement
This helps companies improve marketing ROI.
3. Finance & Banking
Banks use analytics for:
- Fraud detection
- Risk analysis
- Customer segmentation
👉 Data helps improve security and decision-making.
4. Healthcare Industry
Hospitals use analytics to:
- Improve patient management
- Predict health trends
- Optimize operations
5. E-commerce Platforms
Online businesses analyze:
- Customer preferences
- Product recommendations
- Conversion rates
👉 This improves customer experience and revenue.
🧠 Why Data Analytics is a Great Career Option
Data Analytics combines:
✔ Business understanding
✔ Technology
✔ Problem-solving
✔ Decision-making
Companies need professionals who can transform data into actionable insights.
📁 Projects Every Data Analytics Student Should Build
To become job-ready, students should build:
- Sales dashboards
- Customer analysis reports
- Marketing analytics dashboards
- Financial data reports
- Power BI visualization projects
👉 Projects create strong portfolios.
⚠️ Common Mistakes Beginners Make
❌ Learning tools without understanding business problems
❌ Ignoring real datasets
❌ Focusing only on theory
❌ Not building dashboards
Practical experience matters the most.
🎯 Skills Required to Become a Data Analyst
The ideal learning roadmap is:
Excel → SQL → Power BI → Python → Projects
This combination helps students become industry-ready.
🚀 Final Thoughts
Data Analytics is transforming how businesses make decisions.
Companies no longer rely only on assumptions.
They rely on:
✔ Data
✔ Insights
✔ Dashboards
✔ Analytics
If you enjoy problem-solving, business insights, and working with data, Data Analytics can become an excellent career path.
👉 Learn tools deeply
👉 Build real dashboards
👉 Work on practical datasets
That’s how you become job-ready in Data Analytics.
🚀 Forsk Coding School – IT Training Institute
Build your career with practical training in coding, AI, and modern technologies. Learn through real projects and industry-focused guidance.
📺 YouTube: https://www.youtube.com/@ForskCodingSchoolJaipur
📘 Facebook: https://www.facebook.com/ForskCodingSchool
📸 Instagram: https://www.instagram.com/forskcodingschool/
💼 LinkedIn: https://www.linkedin.com/company/forskcodingschool
#ITTraining #Coding #ArtificialIntelligence #WebDevelopment #CareerGrowth #Jaipur