Measures of Dispersion
Measures of Dispersion
Measures of Dispersion are essential statistical tools used in Business Analytics, Data Analytics, Data Science, Artificial Intelligence, Finance, Marketing, and Business Intelligence. While Measures of Central Tendency such as Mean, Median, and Mode describe the center of a dataset, they do not explain how spread out the data is. Two datasets can have the same average but very different levels of variability.
Measures of Dispersion help analysts understand the spread, consistency, variation, and stability of data. Organizations use these statistical measures to evaluate business performance, assess risk, identify anomalies, compare datasets, and make data-driven decisions.
In this lesson, you will learn the fundamentals of Measures of Dispersion, including Range, Variance, Standard Deviation, Coefficient of Variation, business applications, calculations, and real-world examples.
What are Measures of Dispersion?
Measures of Dispersion are statistical techniques used to measure how far data values are spread from the center of a dataset.
Dispersion measures help answer questions such as:
- How consistent are sales figures?
- How much do customer purchases vary?
- How stable are profits over time?
- How risky is an investment?
Understanding variability is critical for effective business analysis.
Why Measures of Dispersion are Important
Organizations use Measures of Dispersion because they help:
- Understand variability
- Measure consistency
- Evaluate risk
- Compare datasets
- Improve forecasting
- Support decision-making
Dispersion provides information that averages alone cannot reveal.
Example Dataset
Dataset A:
| Sales |
|---|
| 50 |
| 50 |
| 50 |
| 50 |
| 50 |
Dataset B:
| Sales |
|---|
| 10 |
| 30 |
| 50 |
| 70 |
| 90 |
Both datasets have the same average:
Mean = 50
However, Dataset B is much more spread out.
Measures of Dispersion help identify these differences.
Understanding Variability
Variability refers to the degree of spread among data values.
Low variability indicates:
- Consistent performance
- Stable outcomes
High variability indicates:
- Greater uncertainty
- Larger fluctuations
Business leaders often prefer lower variability because it supports predictable planning.
Types of Measures of Dispersion
The most common Measures of Dispersion include:
- Range
- Variance
- Standard Deviation
- Coefficient of Variation
Each measure provides unique insights.
Range
Range is the simplest measure of dispersion.
Formula:
Range=Maximum Value−Minimum Value
Range measures the difference between the highest and lowest values.
Range Example
Dataset:
20, 30, 40, 50, 60
Maximum Value = 60
Minimum Value = 20
Range:
60 – 20 = 40
The dataset has a range of 40.
Business Applications of Range
Organizations use Range for:
Sales Analysis
Measure sales fluctuations.
Inventory Monitoring
Track stock variations.
Quality Control
Monitor product consistency.
Range provides a quick overview of variability.
Advantages of Range
Easy to Calculate
Requires only two values.
Quick Understanding
Provides immediate insight into spread.
Range is useful for preliminary analysis.
Limitations of Range
Uses Only Two Values
Ignores most observations.
Sensitive to Outliers
Extreme values can distort results.
More advanced dispersion measures are often preferred.
Understanding Variance
Variance measures how far data values are spread around the Mean.
Variance calculates the average squared deviation from the Mean.
A larger variance indicates greater variability.
Variance is one of the most important statistical measures.
Population Variance Formula
σ^2=∑(X−μ)^2/N
Where:
- σ² = Population Variance
- X = Individual Value
- μ = Population Mean
- N = Number of Observations
Variance quantifies overall dispersion.
Sample Variance Formula
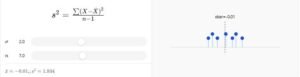
Sample Variance is commonly used in Business Analytics.
Most business analyses rely on sample data rather than complete populations.
Variance Example
Dataset:
10, 20, 30
Mean:
20
Squared Deviations:
100, 0, 100
Variance:
(100 + 0 + 100) ÷ 3
Variance = 66.67
Variance measures the average squared distance from the mean.
Business Applications of Variance
Organizations use Variance for:
Financial Analysis
Measure investment volatility.
Sales Forecasting
Evaluate sales consistency.
Risk Assessment
Identify uncertainty.
Quality Management
Monitor process variation.
Variance supports performance evaluation.
Understanding Standard Deviation
Standard Deviation is the square root of Variance.
It is the most widely used Measure of Dispersion.
Formula:
σ=sqrt[σ^2]
Standard Deviation provides variability in the same units as the original data.
This makes interpretation easier.
Standard Deviation Example
Using Variance:
66.67
Standard Deviation:
√66.67
Standard Deviation ≈ 8.16
The average distance from the mean is approximately 8.16 units.
Why Standard Deviation is Important
Standard Deviation helps analysts understand:
- Data consistency
- Business stability
- Forecast reliability
- Financial risk
It is one of the most commonly used statistical measures.
Low Standard Deviation
Low Standard Deviation indicates:
- Stable performance
- Consistent results
- Reduced uncertainty
Example:
Monthly sales consistently close to the average.
Organizations often prefer low variability.
High Standard Deviation
High Standard Deviation indicates:
- Greater variability
- Higher uncertainty
- Increased risk
Example:
Highly fluctuating monthly sales.
High variability often requires further investigation.
Business Applications of Standard Deviation
Sales Analytics
Measure sales consistency.
Customer Analytics
Analyze spending behavior.
Finance
Evaluate investment risk.
Operations
Monitor production quality.
Standard Deviation supports numerous business decisions.
Coefficient of Variation (CV)
The Coefficient of Variation compares variability relative to the Mean.
Formula:
CV=(σ/μ)×100
Where:
- σ = Standard Deviation
- μ = Mean
CV is expressed as a percentage.
Why Coefficient of Variation is Useful
CV allows analysts to compare datasets with different units or scales.
Example:
Compare:
- Product Sales
- Marketing Costs
Even if their values differ significantly.
CV provides a standardized measure of variability.
Measures of Dispersion in Business Analytics
Business Analytics frequently uses:
Range
Quick variability checks.
Variance
Statistical modeling.
Standard Deviation
Performance analysis.
Coefficient of Variation
Comparative analysis.
These measures support evidence-based decision-making.
Measures of Dispersion in Finance
Finance professionals use dispersion measures for:
- Portfolio analysis
- Investment risk
- Market volatility
- Asset performance
Risk assessment heavily depends on Standard Deviation.
Measures of Dispersion in Marketing
Marketing teams analyze:
- Campaign performance variability
- Customer response rates
- Conversion fluctuations
Dispersion measures improve campaign evaluation.
Measures of Dispersion in Operations
Operations teams monitor:
- Production consistency
- Quality control
- Process stability
Low variability often indicates operational excellence.
Comparing Dispersion Measures
| Measure | Purpose |
|---|---|
| Range | Overall spread |
| Variance | Average squared deviation |
| Standard Deviation | Average deviation from Mean |
| Coefficient of Variation | Relative variability |
Each measure serves a unique analytical purpose.
Common Mistakes
Using Range Alone
May overlook important patterns.
Ignoring Outliers
Can distort results.
Misinterpreting Variance
Variance units differ from original data.
Comparing Standard Deviations Without Context
Can lead to incorrect conclusions.
Analysts should use multiple dispersion measures.
Best Practices
Analyze Variability Alongside Averages
Gain a complete understanding.
Identify Outliers
Assess their impact.
Use Standard Deviation Frequently
Provides meaningful interpretation.
Compare Multiple Measures
Improve analytical accuracy.
These practices strengthen statistical analysis.
Real-World Example
A retail company analyzes monthly revenue.
Average Revenue:
₹500,000
However, Standard Deviation:
₹150,000
The high variability indicates unstable sales performance.
Management investigates:
- Seasonal fluctuations
- Marketing effectiveness
- Product demand changes
Using Measures of Dispersion, the company improves forecasting and planning.
This demonstrates the practical value of Measures of Dispersion in Business Analytics.
Learning Outcomes
After completing this lesson, you will be able to:
- Understand Measures of Dispersion.
- Calculate Range, Variance, and Standard Deviation.
- Interpret data variability.
- Compare datasets using Coefficient of Variation.
- Apply dispersion measures in Business Analytics.
- Support risk assessment and decision-making.
Frequently Asked Questions (FAQs)
What are Measures of Dispersion?
Measures of Dispersion describe how spread out data values are within a dataset.
What is Range?
Range is the difference between the maximum and minimum values.
What is Variance?
Variance measures the average squared deviation from the Mean.
What is Standard Deviation?
Standard Deviation is the square root of Variance and measures average variability.
Why is Standard Deviation important?
It helps analysts understand consistency, uncertainty, and risk.
What is the Coefficient of Variation?
The Coefficient of Variation measures relative variability as a percentage.
Why are Measures of Dispersion important in Business Analytics?
They help organizations evaluate stability, risk, forecasting accuracy, and performance consistency.